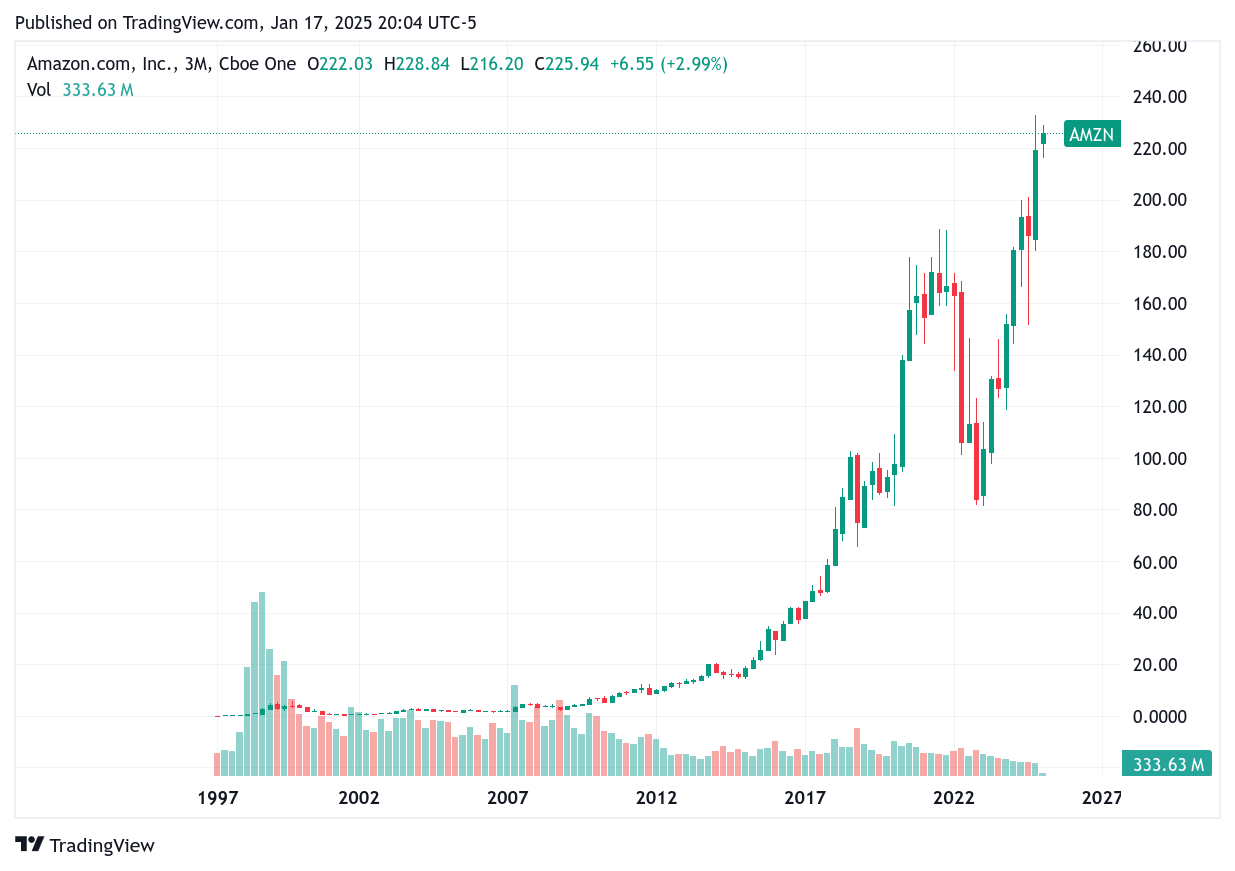
Amazon Technicals
When trading I recommend fundamentals (what to buy) though technical analysis helps you understand when to buy.

Here’s the recent technical data for amazon
Technical Analysis for AMZN:
--------------------------------------------------
Current Price: 225.94
52 Week High: 233.00
52 Week Low: 151.61
RSI: 48.59
SMA_20: 222.79
EMA_20: 221.86
SMA_50: 216.88
EMA_50: 215.62
SMA_100: 201.02
EMA_100: 205.94
SMA_200: 192.12
EMA_200: 194.32
Bollinger Upper: 229.17
Bollinger Middle: 222.79
Bollinger Lower: 216.40
MACD: 1.22
MACD Signal: 1.87
Average Volume (20 day): 32196163.65

I got that data by using a python script.
import yfinance as yf
import pandas as pd
import numpy as np
from datetime import datetime, timedelta

def calculate_rsi(data, periods=14):
    """Calculate Relative Strength Index"""
    delta = data['Close'].diff()
    gain = (delta.where(delta > 0, 0)).rolling(window=periods).mean()
    loss = (-delta.where(delta < 0, 0)).rolling(window=periods).mean()
    rs = gain / loss
    return 100 - (100 / (1 + rs))

def calculate_moving_averages(data):
    """Calculate various moving averages"""
    ma_periods = [20, 50, 100, 200]  # Common moving average periods
    mas = {}
    for period in ma_periods:
        mas[f'SMA_{period}'] = data['Close'].rolling(window=period).mean()
        mas[f'EMA_{period}'] = data['Close'].ewm(span=period, adjust=False).mean()
    return mas

def calculate_bollinger_bands(data, period=20):
    """Calculate Bollinger Bands"""
    sma = data['Close'].rolling(window=period).mean()
    std = data['Close'].rolling(window=period).std()
    upper_band = sma + (std * 2)
    lower_band = sma - (std * 2)
    return upper_band, sma, lower_band

def calculate_macd(data):
    """Calculate MACD"""
    exp1 = data['Close'].ewm(span=12, adjust=False).mean()
    exp2 = data['Close'].ewm(span=26, adjust=False).mean()
    macd = exp1 - exp2
    signal = macd.ewm(span=9, adjust=False).mean()
    return macd, signal

def get_technical_analysis(ticker_symbol='AMZN'):
    """Main function to get technical analysis for a stock"""
    try:
        # Get stock data for the past year
        end_date = datetime.now()
        start_date = end_date - timedelta(days=365)

        stock = yf.Ticker(ticker_symbol)
        data = stock.history(start=start_date, end=end_date)

        if data.empty:
            return f"No data found for ticker {ticker_symbol}"

        # Calculate technical indicators
        technical_data = {}

        # Basic price information
        technical_data['Current Price'] = data['Close'].iloc[-1]
        technical_data['52 Week High'] = data['High'].max()
        technical_data['52 Week Low'] = data['Low'].min()

        # RSI
        technical_data['RSI'] = calculate_rsi(data).iloc[-1]

        # Moving Averages
        mas = calculate_moving_averages(data)
        for ma_name, ma_values in mas.items():
            technical_data[ma_name] = ma_values.iloc[-1]

        # Bollinger Bands
        upper_band, middle_band, lower_band = calculate_bollinger_bands(data)
        technical_data['Bollinger Upper'] = upper_band.iloc[-1]
        technical_data['Bollinger Middle'] = middle_band.iloc[-1]
        technical_data['Bollinger Lower'] = lower_band.iloc[-1]

        # MACD
        macd, signal = calculate_macd(data)
        technical_data['MACD'] = macd.iloc[-1]
        technical_data['MACD Signal'] = signal.iloc[-1]

        # Volume Analysis
        technical_data['Average Volume (20 day)'] = data['Volume'].rolling(window=20).mean().iloc[-1]

        return technical_data

    except Exception as e:
        return f"Error analyzing {ticker_symbol}: {str(e)}"

def main():
    """Main function to run the program"""
    # Get user input
    ticker = input("Enter stock ticker symbol (press Enter for AMZN): ").strip().upper()
    if not ticker:
        ticker = 'AMZN'

    # Get and display technical analysis
    results = get_technical_analysis(ticker)

    if isinstance(results, dict):
        print(f"\nTechnical Analysis for {ticker}:")
        print("-" * 50)
        for indicator, value in results.items():
            print(f"{indicator}: {value:.2f}")
    else:
        print(results)

if __name__ == "__main__":
    main()
I also have a substack about artificial intelligence

https://artificialint.substack.com


